目次
前回のあらすじ
確率的勾配降下法を使って予測をしてみました。
うまくいかなかったので、別の方法を試すことにしました。
LSTM
時系列分析の代表モデルと言えばLSTMだと思います。
というわけで前回とはプログラムを分けて実装しました。
import pandas as pd
import numpy as np
from sklearn.preprocessing import MinMaxScaler
from tensorflow.keras.models import Sequential
from tensorflow.keras.layers import Dense, LSTM, Input
import matplotlib.pyplot as plt

import glob
dm_fol = './datamart/'
stock_list = glob.glob(dm_fol + "*.parquet")

# データの読み込みと前処理
def preprocess_data(df, time_step=60):
    df['Close'] = df['Close'].astype(float)
    data = df[['Close']].values

    # データのスケーリング
    scaler = MinMaxScaler(feature_range=(0, 1))
    scaled_data = scaler.fit_transform(data)

    # LSTM用のデータセット作成
    X, Y = [], []
    for i in range(time_step, len(scaled_data)):
        X.append(scaled_data[i-time_step:i, 0])
        Y.append(scaled_data[i, 0])

    X, Y = np.array(X), np.array(Y)
    X = X.reshape(X.shape[0], X.shape[1], 1)

    return X, Y, scaler

# LSTMモデルの構築
def create_lstm_model(input_shape):
    model = Sequential()
    model.add(Input(shape=input_shape))  # Inputオブジェクトを使用して入力形状を指定
    model.add(LSTM(50, return_sequences=True))
    # model.add(LSTM(50, return_sequences=True, input_shape=input_shape))
    model.add(LSTM(50, return_sequences=False))
    model.add(Dense(25))
    model.add(Dense(1))
    model.compile(optimizer='adam', loss='mean_squared_error')
    return model

# モデルの評価とプロット
def evaluate_model(df, model, scaler, X_train, y_train, X_test, y_test, time_step, sticker_name):
    y_train_pred = model.predict(X_train)
    y_test_pred = model.predict(X_test)

    y_train_pred = scaler.inverse_transform(y_train_pred)
    y_test_pred = scaler.inverse_transform(y_test_pred)

    y_train = scaler.inverse_transform([y_train])
    y_test = scaler.inverse_transform([y_test])

    train_mse = np.mean((y_train_pred - y_train[0]) ** 2)
    test_mse = np.mean((y_test_pred - y_test[0]) ** 2)
    print(f"Train Mean Squared Error: {train_mse}")
    print(f"Test Mean Squared Error: {test_mse}")

    # プロット
    df.set_index('Date', inplace=True)
    train_dates = df.iloc[time_step:len(y_train[0])+time_step].index
    test_dates = df.iloc[len(y_train[0])+time_step-1:-1].index

    plt.figure(figsize=(14, 7))
    # plt.plot(train_dates, y_train[0], label='Train Actual', color='black')
    plt.plot(test_dates, y_test[0], label='Test Actual', color='red')
    plt.plot(test_dates, y_test_pred, label='Test Predicted', color='blue')
    plt.title(sticker_name+': Actual vs Predicted Stock Prices')
    plt.xlabel('Date')
    plt.ylabel('Close')
    plt.legend()
    plt.show()

# 次の日の予測
def predict_next_day(model, scaler, df, time_step=60):
    data = df[['Close']].values
    last_data = data[-time_step:]
    last_data_scaled = scaler.transform(last_data)
    X_input = last_data_scaled.reshape(1, time_step, 1)
    next_day_prediction = model.predict(X_input)
    next_day_prediction = scaler.inverse_transform(next_day_prediction)
    print(f"Next Day Prediction: {next_day_prediction[0][0]}")

# データの読み込み
for count, stock_data in enumerate(stock_list):
  df = pd.read_parquet(stock_data)
  sticker_name = stock_data.split('\\')[1].replace('.parquet', '')

  # データの前処理
  time_step = 60
  X, Y, scaler = preprocess_data(df, time_step)

  # データの分割
  train_size = int(len(X) * 0.8)
  X_train, X_test = X[:train_size], X[train_size:]
  y_train, y_test = Y[:train_size], Y[train_size:]

  # モデルの構築と訓練
  model = create_lstm_model((X_train.shape[1], 1))
  model.fit(X_train, y_train, batch_size=1, epochs=1)

  # モデルの評価
  evaluate_model(df, model, scaler, X_train, y_train, X_test, y_test, time_step, sticker_name)

  # 次の日の予測
  predict_next_day(model, scaler, df, time_step)
コード確認
    # LSTM用のデータセット作成
    X, Y = [], []
    for i in range(time_step, len(scaled_data)):
        X.append(scaled_data[i-time_step:i, 0])
        Y.append(scaled_data[i, 0])

    X, Y = np.array(X), np.array(Y)
    X = X.reshape(X.shape[0], X.shape[1], 1)
LSTM用のデータセットは60日分のデータを学習として使い、次の日を出力として使用するという特徴があります。
それを計算しやすい配列に変換し、LSTM用にデータをリシェイプします。
    model = Sequential()
    model.add(Input(shape=input_shape))  # Inputオブジェクトを使用して入力形状を指定
    model.add(LSTM(50, return_sequences=True))
    # model.add(LSTM(50, return_sequences=True, input_shape=input_shape))
    model.add(LSTM(50, return_sequences=False))
    model.add(Dense(25))
    model.add(Dense(1))
    model.compile(optimizer='adam', loss='mean_squared_error')
モデルの初期化後、入力形状の指定。各レイヤーを追加して最終的に出力値を1にします。
モデルをコンパイルする際はアルゴリズムをadam、損失関数をmseに設定してモデルの構築が完了します。
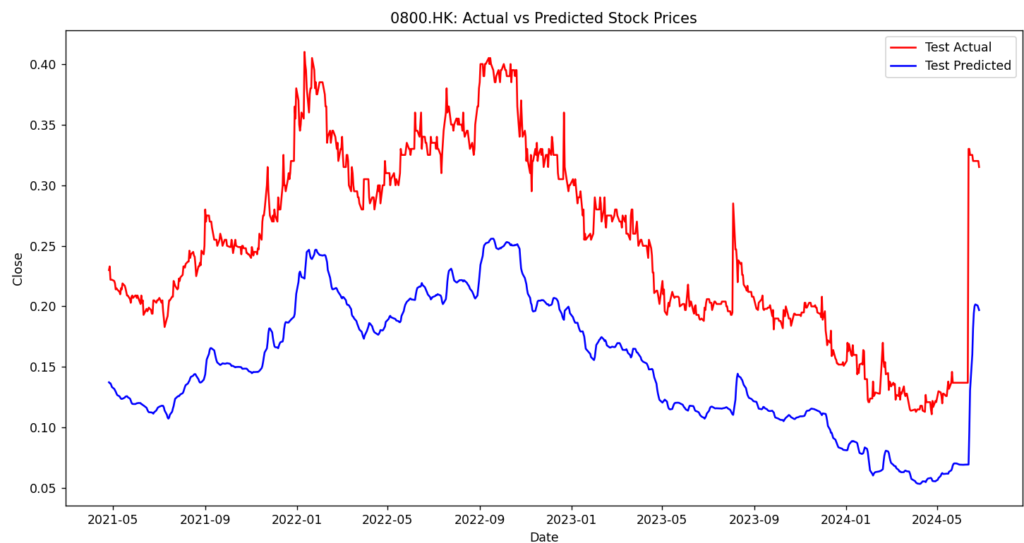
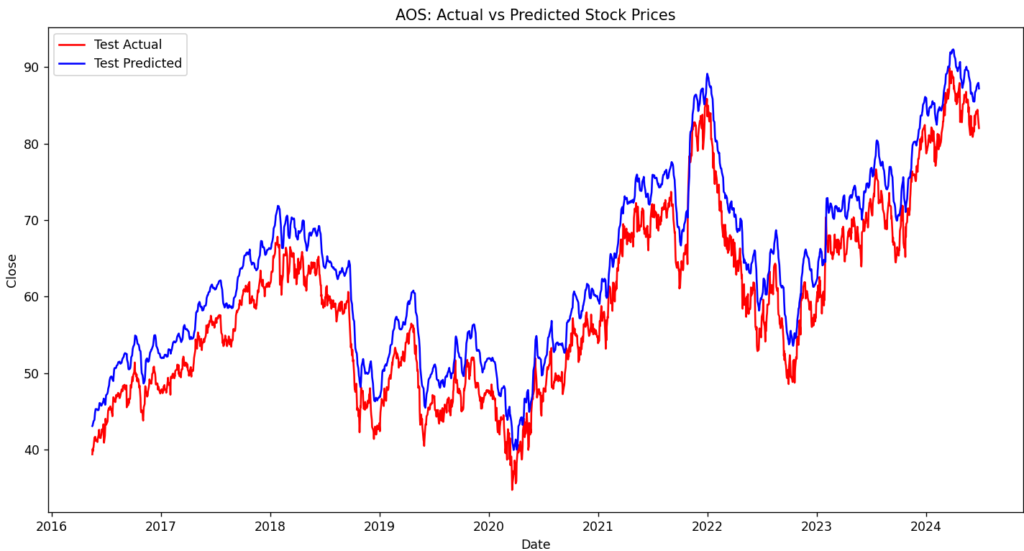
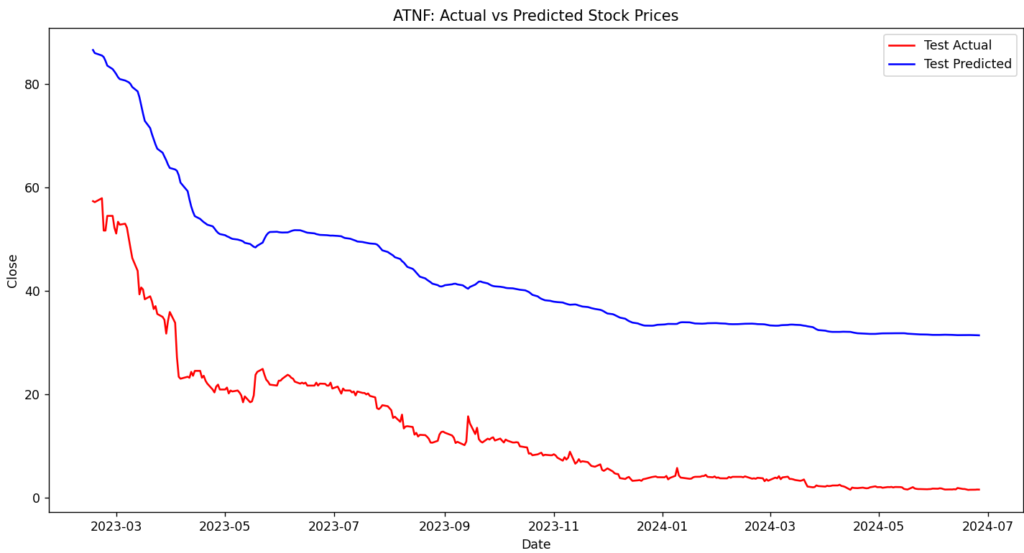
プロットと予測を行って完了になります。プロットした結果がこちらです。


データ量が多い場合は予測との差が少なく、少ない場合は予測との差が大きいです。
また、前回と違いマイナスの値にもならず、直線気味でも近いような値が出力されます。
後は株価の値によっても変わりそうですね。1枚目は1以下の値を予測してますが、2,3枚目は1以上の値を予測してますので。
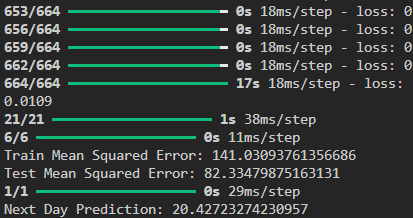
一応コンソールに予測値を出しています。

終わりに
今回の予測でだいぶ近いことができるようになりました。
今回は特徴量1で学習していたので、特徴量を追加して試行錯誤してみようと思います。
他にも”ARIMA”や”Prophet”がありますので試してみたいと思います。ではでは。

【一時帰国でのtransitや検閲で焦った話】|ワーホリ in NZ × 英語力アップ/IELTS対策

【ExploreTekapoでHousekeeperとreceptionで働いているよ】|ワーホリ in NZ × 英語力アップ/IELTS対策

【QueenstownのLugeをめいいっぱい満喫してきたよ】|ワーホリ in NZ × 英語力アップ/IELTS対策

【ニュージーランドでengine oilとengine filterを交換とタイヤの空気入れをしてきたよ】|ワーホリ in NZ × 英語力アップ/IELTS対策
